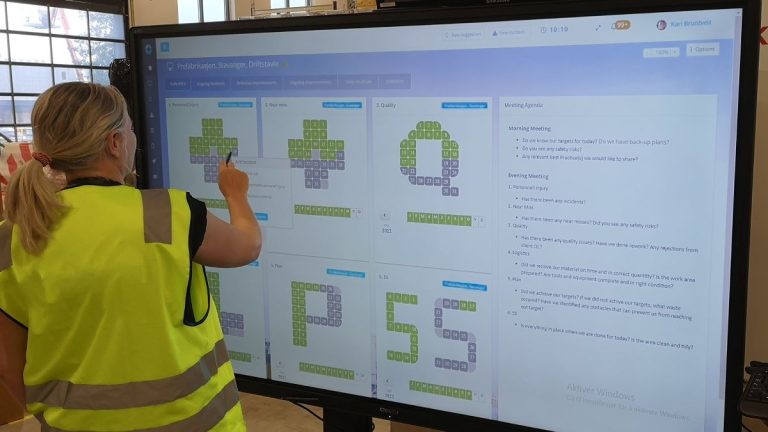
Visualization is a key element to utilizing the information you have access to. Accessing the data typically means you can extract data and export it to Excel or other standard file types. But this often proves ineffective when it comes to daily management.
A system integration towards a data visualization application, dashboard etc. is absolutely the best option here. Let the data flow and concentrate more on the analyses.
- Product
Interactive boards. Fully customizable.
Capture, prioritize and follow up improvements.
Report and manage incidents. Visualize reports and statistics.
Operationalize your strategies and integrate your whole organization.
Access your tools in Microsoft Teams.
Customized templates. Problem solving, business development etc.
Manage project individually or in portfolios with visual and interactive tools.
Create and share best practices, one-point-lectures and standards.
Easy access to tasks, improvements and incidents.
Integrate DigiLEAN with your existing IT systems.
Meeting the demand of larger organizations.
High security level by default.
In less than 4 min
- Use Cases

Interactive tools for both shop floor and administration.
Visual project management.
Maintain standards. Manage incidents and discrepancies.
Manage tasks, integrate with problem-solving and continuous improvement.
Lean daily management tailored for healthcare.
Team task management, problem-solving and visualization.Case management, improvements, problem-solving, and strategy alignment.We have a LEAN solution for you too. Just ask!
We meet the demand of larger organizations.
- Pricing
- Shop Floor


